The Polygraph Place

Thanks for stopping by our bulletin board.
Please take just a moment to register so you can post your own questions
and reply to topics. It is free and takes only a minute to register. Just click on the register link


  Polygraph Place Bulletin Board
  Professional Issues - Private Forum for Examiners ONLY
  EDA

Post New Topic  Post A Reply
profile | register | preferences | faq | search

next newest topic | next oldest topic
Author Topic:   EDA
rnelson
Member
posted 02-13-2013 02:13 AM     Click Here to See the Profile for rnelson   Click Here to Email rnelson     Edit/Delete Message
Everyone wants good EDA data. Nobody wants bad data.

While we are all contemplating utter silence due to insuilts and threats of lawsuits, we are at risk for loosing the main value of this forum – aside from friendships - and loosing an opportunity for important discussion about how the EDA works, and what to expect from it.

Different EDA modes are a sometimes acute topic - especially when they disagree. Most of the time they will agree. But nothing is perfect, and so sometimes they may be observed to disagree. This may not be an issue of defectiveness but of imperfectness. EDA data, like the polygraph as a whole, seems to be very good but still imperfect. I know I'm ranting on that – only because others are ranting on less sensible messages.

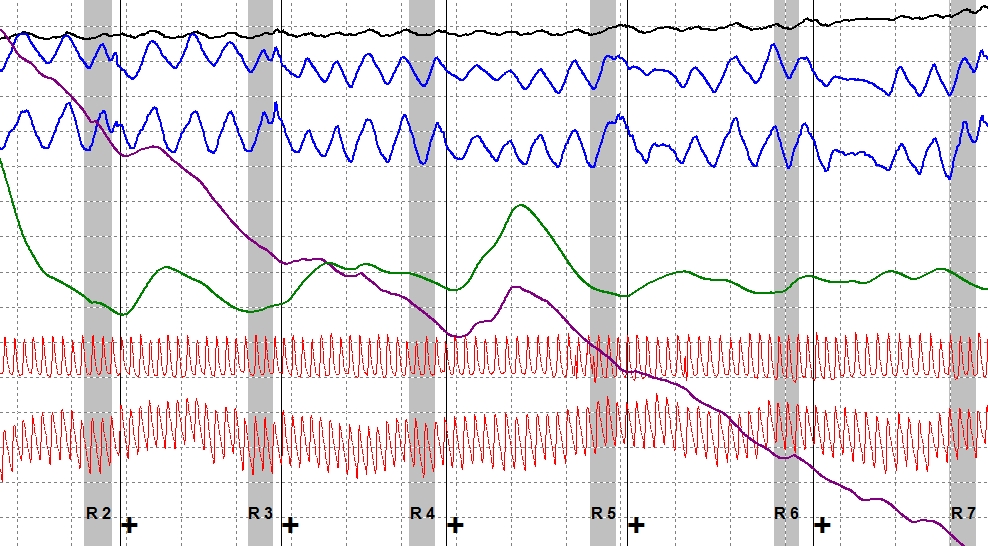
You can see in the first graphic (reposted below from the other thread) that C4 shows a greater reaction than R6 using the Auto EDA (green), while R6 shows a greater reaction than C4 using the Raw EDA (purple). If you use the Federal bigger-is-better rule, reliant upon visibly discernable differences, then you can imagine what happens to the numerical score.

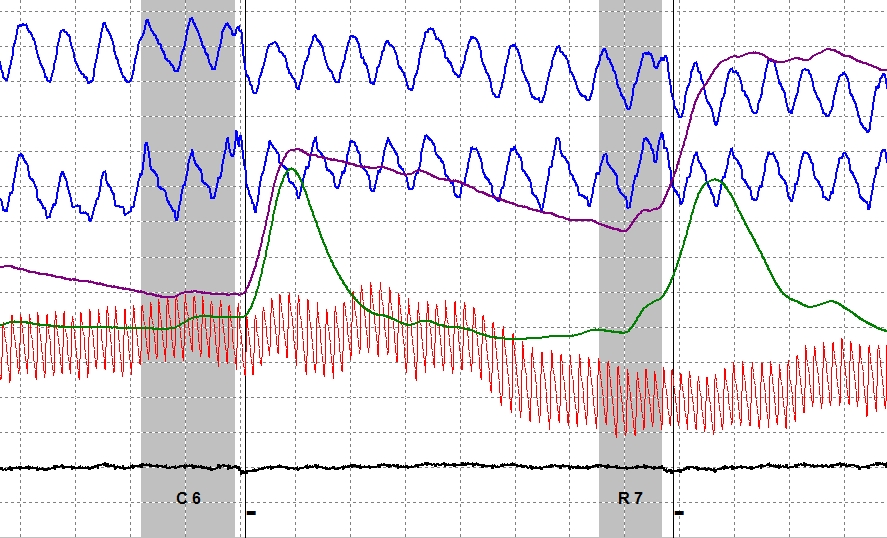
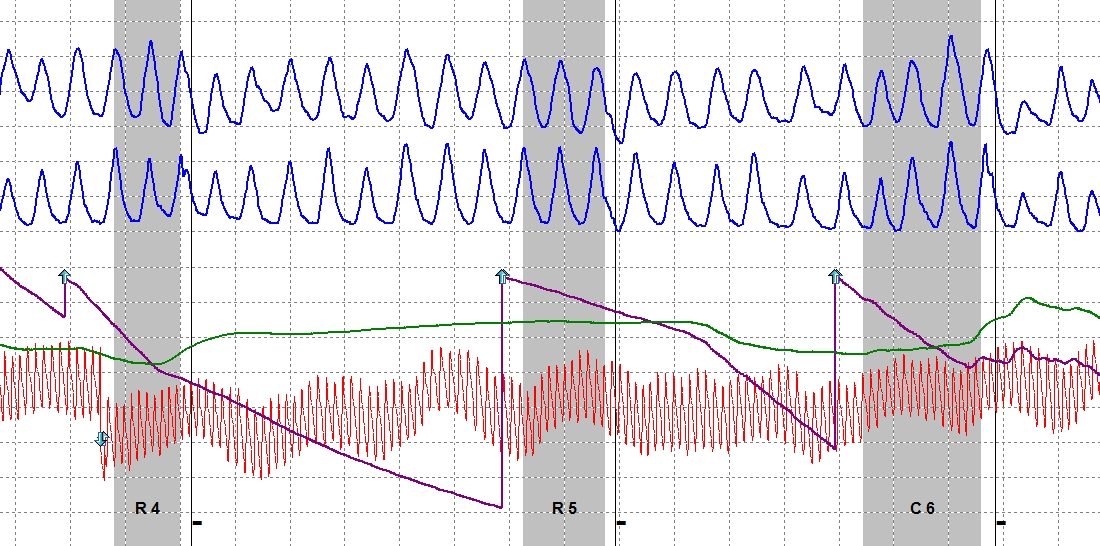
In the second graphic (also reposted below from the other thread) C6 and R7 appear to have nearly equal vertical response magnitude using the Auto EDA (green) though you will see that C6 is slightly larger if you look closer (as they like to say). Using the Raw EDA you will notice that R7 is greater than C6.

Here is another.

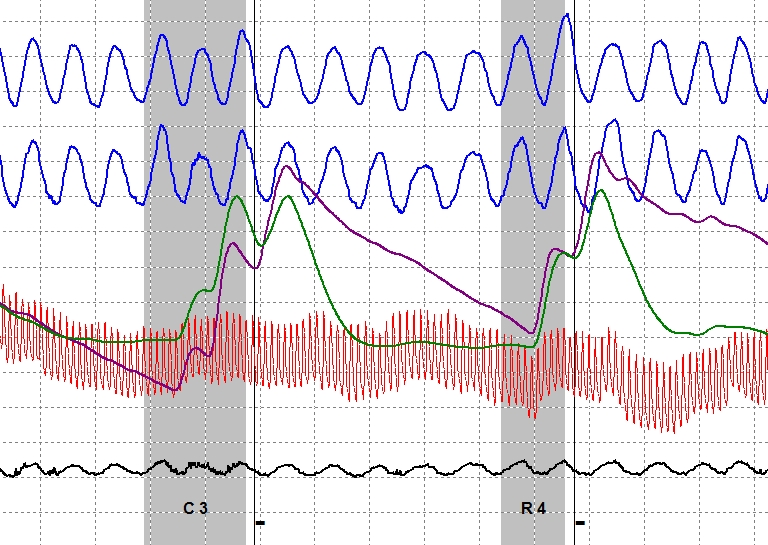
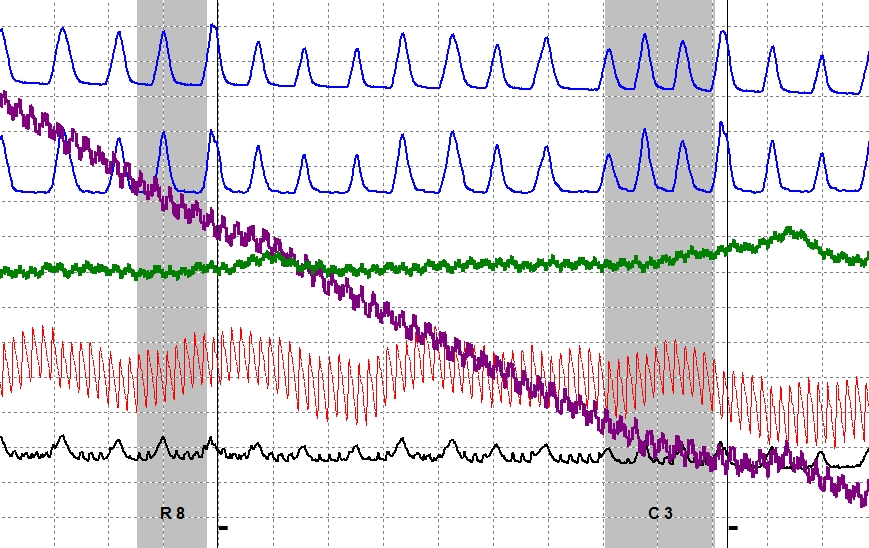
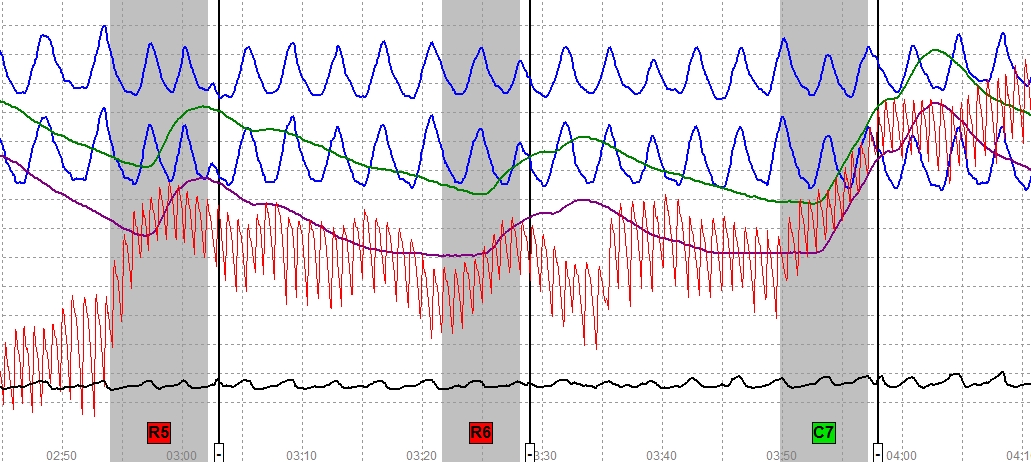
You can in this one that C3 and R4 are largely equivalent using the Auto EDA (green). Someone with more accute eyesight than me will notice that R4 is actually slightly larger. Using the Raw EDA (purple) C4 is clearly larger than R4.

It is my hope that when we are done being afraid of the truth about EDA signal processing, and done being afraid of lawsuits, and done with misleading marketing strategies, then we can someday have an open and honest conversation about EDA.

One thing is certain, nobody enjoys plunging EDA.

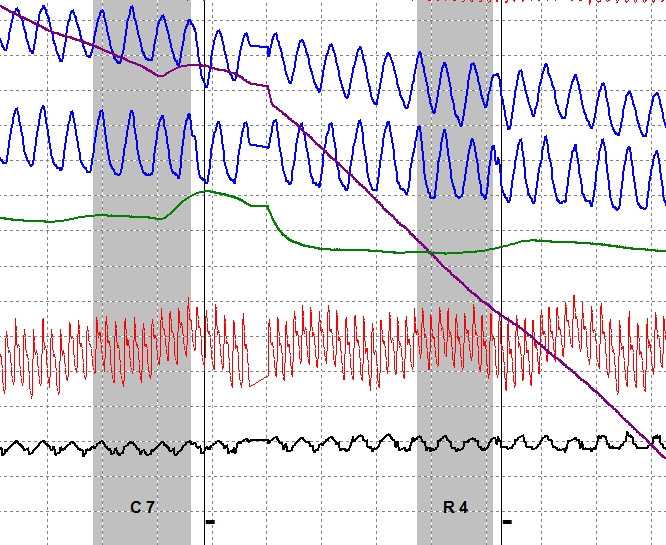
This is a good example of several issues, one of which is that descending EDA data, for some persons, is a known issue that is described in the psychophysiology literature. Another issue here is a sudden, though brief, stoppage of data acquisition. I'm hoping an engineer will explain that to me some day, because I've seen it on other charts too. And finally, look closer at R4 and you'll notice something that mystifies us field examiners – until we learn to understand EDA data in terms of a spectrum of frequencies in which descending and tonic activity are very low frequenceis while scorable reactions are slighly higher frequencies and noisy/ugly data are even higher frequencies. In this segment at R4 the Auto EDA shows an upward reaction during the response-onset-window. while the Raw EDA (purple) is persistently going downward at the same time. There is a slight reduction in the rate of downward activity – which is actually a change in the frequency spectrum of the wave form (i.e., a reduction of the proportion of very low frequencies and increase in the proportion of higher frequencies). What we don't yet know is whether that observable change is indicative of the kind of increased sympathetic/autonomic nervous system activity that we want to score.

Additionally, you notice the descending pnuemos - I'm not sure if that is caused by a sensor that is sliding around on the examinee or by a faulty component.

Here is another descending EDA example.

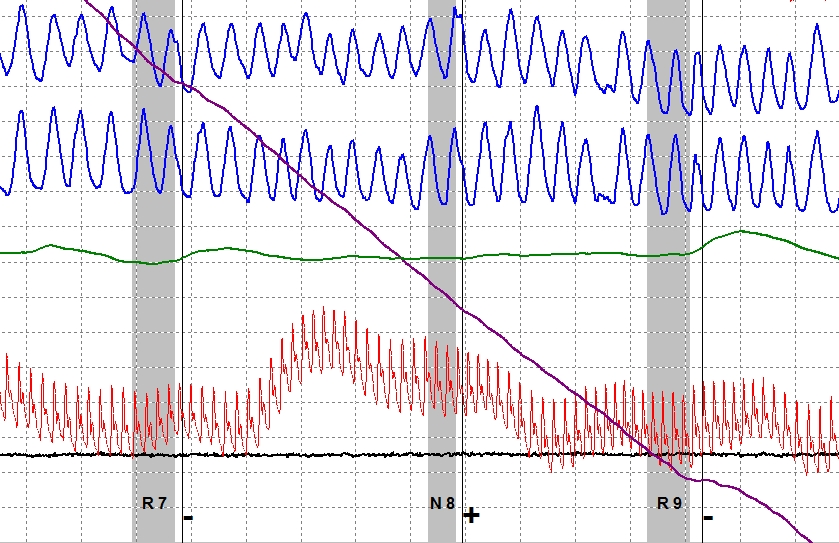
This one you can see the pneumos are more stable. This is an RI (relevant-irrelevant) exam, and you can see the same issue at R7, in which the Auto EDA (green) and Raw EDA (purple) seem to go different directions. There is a reason for this and a way to make sense and understand it, even though it is challenging for us if we are not thinking about the data in the right way.

Sometimes you can still get responses out of descending Raw EDA, and sometimes the Auto will find things we cannot see. Look at closer at R4 (below) and you'll see a good example of the odd phenomena.

Sometimes the data are fairly obvious even when the EDA data are plunging. This one is a CIT exam.

Other times the EDA data are fuzzy and noisy as if impaired by radio frequency interference – perhaps from a cell-phone tower on the office building room, or a high-power transformer or transmitter or something that provides a lot of radio-frequency interferenece. Here the noisy data is combined with the plunging unresponsive data.

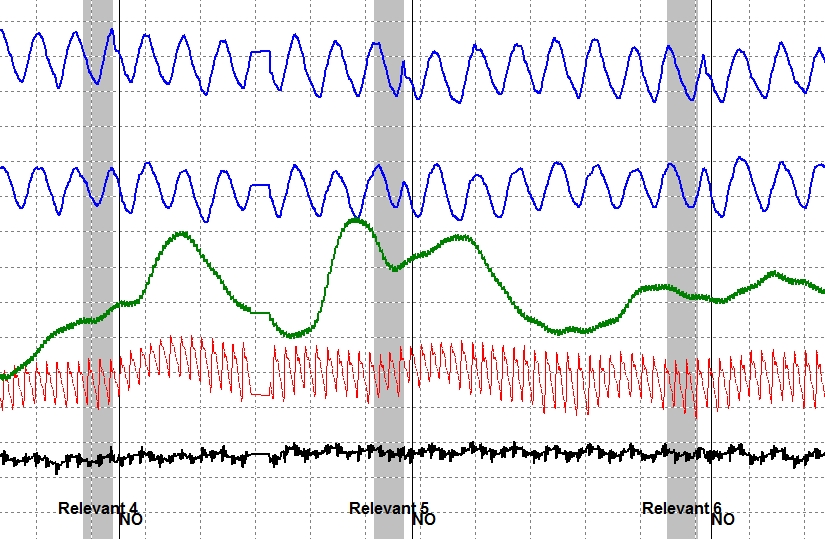
Sometimes the EDA data work despite the fact that it is impaired by lots of fuzzy noise. Three relevants in a row reveals this as another CIT exam.

Look closer (above) and you'll see that data acquisition stoppage again. Where's an engineer when you need one.

Look even closer and you will notice that NONE of these exams was conducted using a Lafayette system.

For reference, here is a graphic of a Lafayette chart.

Look at the details. Don't be confused by the display colors, and don't be confused by marketing hype.

EDA data work fine most of the time, but try not to be surprised when you find something that ain't perfect.

The point of all this is not to point fingers and not to cause trouble. The point is this: lets be realistic and lets be honest about the fact that the instruments seem to work well despite their imperfections and despite their differences.

I used an Axciton for a few years and enjoyed it. I used a Limestone for a few years and enjoyed it. Now I use a Lafayette and I enjoy it too. Sure I would like to try to convince everyone that the Lafayette is the best and the others not so much, but I'm not willing to be dishonest to do that. I'm not interested in more conflict, but I'm also not interested in being bullied and maligned.

There is an ethical issue with the EDA, but it is not a matter of defectiveness or deficiency. The ethical issue is whether instrument manufacturers are going to compete so aggressively that they/we mislead field examiners, trainers, quality control people, and program managers about what to expect from the EDA.

- more later – its late and I still have to replace a squealing exhaust inducer fan or my furnace will never let me sleep.

.02

r

------------------
"Gentlemen, you can't fight in here. This is the war room."
--(Stanley Kubrick/Peter Sellers - Dr. Strangelove, 1964)

Disclaimer: the views and opinions expressed herein are those of the author and not the LIC or the APA.

[This message has been edited by rnelson (edited 02-13-2013).]

IP: Logged

Ted Todd
Member
posted 02-13-2013 08:33 AM     Click Here to See the Profile for Ted Todd     Edit/Delete Message
Ray,
Thanks for bringing science and sanity back to this forum. I am sure it is only a matter of time before some "Black Night" jumps back in but the break was nice while it lasted.

Keep up the great discussions.

Ted

IP: Logged

Bill2E
Member
posted 02-13-2013 11:55 AM     Click Here to See the Profile for Bill2E   Click Here to Email Bill2E     Edit/Delete Message
Ray,
Thanks for the charts and the information. I also have had some charts with plunging EDA on my CPS II . I think it happens on some persons because of their own body system. It is not always a manufacturer problem. I am so drained by the posts on the other thread, I have decided not to post there and engage in that silliness. If the administrator allows them to continue I will simply not post and discontinue monitoring.

IP: Logged

rnelson
Member
posted 02-14-2013 07:42 AM     Click Here to See the Profile for rnelson   Click Here to Email rnelson     Edit/Delete Message
Painful as is has been, Dan did manage to raise our awareness of some important things. He also stimulated more discussion than I will initiate in my entire lifetime.

Out of fairness to Jamie and the good folks at Limestone, and Lafayette - and the other instrument manufacturers - we should be reminded that these concerns with occasional EDA scores are actually un-common. It is possible that these occurrences are not an issue of deficiency but simply part of the normally expected proportion of uncontrolled variance inherent to any test procedure. The Limestone instrument, like the Lafayette, works exactly as intended most of the time, under most circumstances, with most persons. Its no secret that I was a very satisfied user of the system, and happy to interact with the folks there. I used the instrument with confidence every day just as I use the Lafayette today. I also a satisfied user of the Axciton before that. My experience with the Stoelting is more limited, but I have no doubts about it. There are no bad instruments. I've said in the past that I though Jamie and Limestone were good for the profession. I also believe they they have been good for Lafayette.

Nobody should have to harbor any nagging anxiety about whether there instrument is telling them the correct information. There are no instruments that are actually bad. They all seem to be quite good, and I would use any of them with confidence. We can return later to their differences and why each might be superior to the other.

We were all aware of EDA issues before this discussion. None of this is new information. We were already working to learn to improve things. It is already known that some areas from improvement were identified in the Lafayette EDA. EDA issues can be identified with all instruments. It is my understanding that Ron Decker talked about the potential for scoring differences between Manual and Auto EDA over 30 years ago – and that his explanation was that it has something to do this the fact that Auto EDA may filter out some data. This is part of the reason we have continued to study the EDA. I'll provide more information later about how we study the EDA and what we have learned about how to reduce the occurrence of these already un-common problems. I may also have a way to model the frequency at which the rare issues may affect the case outcome – but that relies on statistical modeling because there may be no way to actually study live data on this.

The real objective is to support the profession. That is my objective, and I believe that is Jamie's objective. In doing that we make a living and feel satisfied.

The challenge for us is to avoid becoming so overconfident that we neglect to remember that there are always remaining issues of uncertainty. When we pretend that there are no remaining areas for improvement we then neglect to work toward improving anything. We are also at risk for becoming calloused towards the real people we work with. The other part of the challenge is to avoid the anxious-neurotic trap of constant self-doubt about the accuracy of decisions in the field.

Polygraph works? Want evidence? Look at Police agencies all over the US. The U.S. enjoys some of the most professional and high caliber policing forces anywhere. Why? I believe part of that is polygraph screening. Recruiting, hiring and training the right good people is the best way. I've met many good law enforcement officers in other countries. These seem to characteristically those countries that also screen their applicants very carefully – often using the polygraph as part of the process. Look around the world and you'll see a lot of countries interested in the polygraph, and what it can do to help improve their experiences with public servants.

While we're all making a living and working intensely on each acute and potentially very dangerous problem, we need to be confident that the instruments we use can always be relied upon to work well when skilled examiners do their work well. There are a lot of good smart people working to develop and provide good instrumentation based on today's best technology.

.02

r


------------------
"Gentlemen, you can't fight in here. This is the war room."
--(Stanley Kubrick/Peter Sellers - Dr. Strangelove, 1964)


IP: Logged

Bill2E
Member
posted 02-14-2013 01:41 PM     Click Here to See the Profile for Bill2E   Click Here to Email Bill2E     Edit/Delete Message
Ray,

Am I understanding that using filters is the main problem? If so, can we just shut down the filters and view the raw data?

IP: Logged

rnelson
Member
posted 02-14-2013 03:13 PM     Click Here to See the Profile for rnelson   Click Here to Email rnelson     Edit/Delete Message
You can.

But as Barry stated. Filtering can improve the usability of the data.

If you read the literature from the 1970s and earlier they report the Pneumos as the most useful and diagnostic data, the cardio next, and the EDA as the least useful, least diagnostic, and most difficult to use.

The difference may have been the difference in electronic amplifiers that improved Cardio data with lower cuff pressures - and Auto EDA modes that make the EDA data more usable when we find those all too common plunging EDA zombies.

Without the Auto mode people tend to just turn in down to the point where it is useless.

Managing the EDA can mean more usable data and more attention toward the examinee not the instrument.

Filtered/Auto EDA actually provides the potential for improving the signal to noise ratio - if we do it right.

I've been studying this a lot lately - using Fourier analysis of the EDA spectrum. We now know the range of frequencies in which we are interested, and where the troublesome data exists.

The goal is to manage the data as little as possible to make it usable, and cause as little potential for change and difference as possible.

Purists will say use manual. I say use the one that works best for you.

Feature development studies by Kircher & Raskin in the 1980s used manual EDA I believe. Studies by Harris, Horner and McQuarrie (2000) and Kircher, Kristjiannson, Gardner & Webb (2005) used Auto EDA.

Stoelting algorithm probably used manual EDA. Polyscore, OSS and OSS-3 and ESS used Auto EDA.

I'd be reluctant to offer a hard and fast rule because someone might be vulnerable to criticism if they found a different choice to be better for them at some time. Agencies have more internal control over this, so some may have rules.

Someday we will have more info on this, but I think there is no question that both work well.

.02

r

------------------
"Gentlemen, you can't fight in here. This is the war room."
--(Stanley Kubrick/Peter Sellers - Dr. Strangelove, 1964)


[This message has been edited by rnelson (edited 02-14-2013).]

IP: Logged

Bill2E
Member
posted 02-15-2013 01:38 PM     Click Here to See the Profile for Bill2E   Click Here to Email Bill2E     Edit/Delete Message
Ray,

I checked my recordings of polygraph on the CPS II and looked closely at the EDA, did a little experimenting with it and then pulled out my old analog Lafayette polygraph and ran some charts on it just to see the differences. I then ran some charts on the CPS II and looked at the differences when using both manual and filtering.

Both Barry and you are correct regarding using filtering to get rid of noise and make the tracings more readable and facilitate easier scoring. I didn't loose the ability to score the charts using either system, the filtered did look better with less noise.

This is not scientific I'm sure, however it gives me a little more insight into what the automatic mode accomplishes. Have you done any experiments or studies on this, or has Barry??

IP: Logged

rnelson
Member
posted 02-15-2013 02:14 PM     Click Here to See the Profile for rnelson   Click Here to Email rnelson     Edit/Delete Message
Bill,

There is nothing unscientific about doing your own mini-experiments and case studies like that. It helps demonstrate, increase understanding and build confidence. The only error would be if anyone attempted to reach conclusions based on small case studies or anecdotes. Annecdotes are for generating questions for new study, and for teaching and demonstrating things we are already fairly sure about. They are just not for answering questions or reaching conclusions.

Of course, if someone finds something inconsistent or anomolous in a mini-experiment or case study, then we still cannot reach conclusions, but it is a great place to start asking questions about what else we should be learning.

Several months ago I started a project working on the EDA. There was a discussion titled "Name that EDA" in which I posted graphics from Fast Fourier Transforms showing the frequency spectrum and different EDA waveforms after putting the same EDA data through different filtering soluations.

Since that time we have isolated the frequency spectrum of interest and the noise spectrum.

In the past Auto EDA modes seem to have been developed heuristically - someone looks at it and decides on some filtering solutions (either a specified number of seconds or number of samples after which the EDA is supposed to return to baseline, or a guess at corner frequencies that will optimize the signal to noise ratio).

Fourier analysis allows us to actually see and mathematically analyze the frequency spectrum of the energy contained in the EDA waveform. We can locate the frequencies we want, and those we don't want. Then we can design signal processing solution to better optimize the signal to noise ratio.

Using confirmed case data we can calculate the correlation and criterion coefficient of different EDA modes (i.e., how well do the different EDA modes contribute to correct numerical scores).

So the answer to your question is yes.

It is not completely surgical, but we yes we can and have been working to optimize our ability to give you good consistent EDA with better signal to noise than the Manual EDA and verified performance characteristics.

The manual EDA is actually highly diagnostic. Its just not fun. The goal is to have EDA that is as good or better than the Manual EDA but is more fun to use.

I'm sure the smart folks at Stoelting and Limestone understand exactly what I'm describing here.

A while ago Skip Webb described some cardiac monitoring or testing technology and even cited standards that imposed specifications on what types of basic filtering was acceptable and what to do if exceptions were made. Our profession still functions on the model of EDA-is-a-black-box-and-ye'r-not-s'posed-to=know-what-we-do-to-it.

If EDA signal processing makes a difference then the profession deserves to know about it.

One of the things I've always like about the Limestone people is that they understand the value and importance of scientific accountability and openness about some things. Stoelting too. They published their feature development studies and algorithm, and the entire profession is benefiting more than most people realize. I'll have more information soon about the Lafayette EDA. Its tedious work, but it really should be done.

.02

r

------------------
"Gentlemen, you can't fight in here. This is the war room."
--(Stanley Kubrick/Peter Sellers - Dr. Strangelove, 1964)


IP: Logged

Bill2E
Member
posted 02-15-2013 04:40 PM     Click Here to See the Profile for Bill2E   Click Here to Email Bill2E     Edit/Delete Message
Ray,
thanks for your hard work and please keep us informed about your research. Some of the time I don't understand what you are talking about. I don't really have the science down and don't do statistics well. Basic math only.

IP: Logged

All times are PT (US)

next newest topic | next oldest topic

Administrative Options: Close Topic | Archive/Move | Delete Topic
Post New Topic  Post A Reply
Hop to:

Contact Us | The Polygraph Place

Copyright 1999-2012. WordNet Solutions Inc. All Rights Reserved

Powered by: Ultimate Bulletin Board, Version 5.39c
© Infopop Corporation (formerly Madrona Park, Inc.), 1998 - 1999.